2026 comparison
Saint-Priest (69) vs Vénissieux: 2026 comparison
Vénissieux has more inhabitants than Saint-Priest: 65,689 versus 49,498, or 33% more. Saint-Priest covers a larger area (29.7 km² versus 15.3 km²), but Vénissieux is more densely populated: 4,285 inhabitants per km² versus 1,666.
The median apartment price is higher in Saint-Priest: €3,057 per m² versus €2,846. The median standard of living is higher in Saint-Priest (€24,110 a year versus €18,980).
The two cities are 5.2 km apart as the crow flies, in the same department and the same urban unit (Lyon).
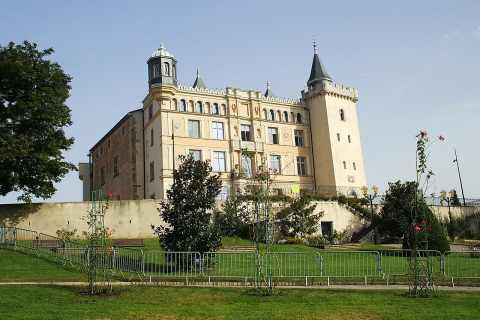
Saint-Priest
City in Rhône
- Population
- 49,498 inhab.
- 137th in France · 5th in its department
- Area
- 29.7 km²
- Density
- 1,666 per km²
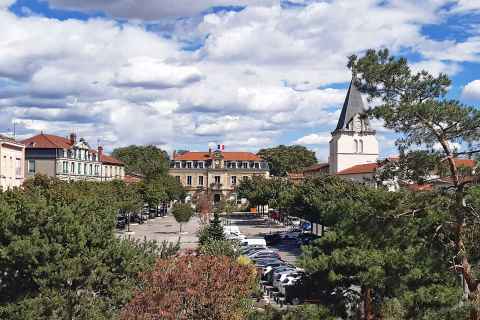


Vénissieux
City in Rhône
- Population
- 65,689 inhab.
- 83rd in France · 3rd in its department
- Area
- 15.3 km²
- Density
- 4,285 per km²
Population
Population and demographics
Municipal population since 1876
Saint-PriestVénissieux
| Criterion | Saint-Priest | Vénissieux | Difference |
|---|---|---|---|
| Population inhab.More populous: Vénissieux+33% | 49,498 | 65,689 | More populous: Vénissieux+33% |
| Change over 5 yearsStronger growth: Saint-Priest+8.3 pts | +5.8% | −2.4% | Stronger growth: Saint-Priest+8.3 pts |
| Change over 10 yearsStronger growth: Saint-Priest+8.3 pts | +14.6% | +6.3% | Stronger growth: Saint-Priest+8.3 pts |
| Density per km²Denser: Vénissieux2.6 times as high | 1,666 | 4,285 | Denser: Vénissieux2.6 times as high |
| Under 15More young people: Vénissieux+1.8 pt | 21.2% | 23.0% | More young people: Vénissieux+1.8 pt |
| 65 and overMore seniors: Saint-Priest+2.0 pts | 16.5% | 14.5% | More seniors: Saint-Priest+2.0 pts |
| People per householdLarger households: Vénissieux+0.04 | 2.34 | 2.38 | Larger households: Vénissieux+0.04 |
Sources: INSEE, official population figures, INSEE, censuses, INSEE, census
Housing
Real estate prices and housing
| Criterion | Saint-Priest | Vénissieux | Difference |
|---|---|---|---|
| Median apartment price €/m²More expensive: Saint-Priest+7% | 3,057 | 2,846 | More expensive: Saint-Priest+7% |
| Median house price €/m²More expensive: Saint-Priest+11% | 3,990 | 3,598 | More expensive: Saint-Priest+11% |
| Apartment rent €/m² per month, utilities includedMore expensive: Saint-Priest+3% | 15.1 | 14.7 | More expensive: Saint-Priest+3% |
| House rent €/m² per month, utilities includedMore expensive: Saint-Priest+9% | 14.8 | 13.5 | More expensive: Saint-Priest+9% |
| Homeowner householdsMore homeowners: Saint-Priest+19 pts | 50.4% | 31.2% | More homeowners: Saint-Priest+19 pts |
| Share of housesMore houses: Saint-Priest+10 pts | 23.6% | 13.4% | More houses: Saint-Priest+10 pts |
| Social housing (SRU law) share of primary residencesMore social housing: Vénissieux+18 pts | 33.0% | 50.8% | More social housing: Vénissieux+18 pts |
| Second homesMore second homes: Vénissieux+0.3 pt | 1.1% | 1.4% | More second homes: Vénissieux+0.3 pt |
| Vacant homesMore vacant homes: Vénissieux+1.0 pt | 8.0% | 9.0% | More vacant homes: Vénissieux+1.0 pt |
| Property tax (combined rate)Higher rate: Vénissieux+1.0 pt | 36.15% | 37.18% | Higher rate: Vénissieux+1.0 pt |
Sources: DGFiP (DVF), Ministry of Housing (rent map), INSEE, census, Ministry for the Ecological Transition (SRU), DGFiP, local taxation
Income and jobs
Residents’ income and jobs
| Criterion | Saint-Priest | Vénissieux | Difference |
|---|---|---|---|
| Median standard of living €/yearHigher: Saint-Priest+27% | 24,110 | 18,980 | Higher: Saint-Priest+27% |
| Poverty rateHigher: Vénissieux+15 pts | 20.5% | 35.2% | Higher: Vénissieux+15 pts |
| Average taxable income per householdHigher: Saint-Priest+37% | €29,102 | €21,200 | Higher: Saint-Priest+37% |
| Households paying income taxMore taxpaying households: Saint-Priest+13 pts | 46% | 33% | More taxpaying households: Saint-Priest+13 pts |
| Activity rate (ages 15-64)Higher: Saint-Priest+7.2 pts | 75.4% | 68.2% | Higher: Saint-Priest+7.2 pts |
| Unemployment rate (census)Higher: Vénissieux+6.3 pts | 12.5% | 18.8% | Higher: Vénissieux+6.3 pts |
Sources: INSEE, Filosofi, DGFiP, income tax, INSEE, census
Local life
Town hall and fiber internet
| Criterion | Saint-Priest | Vénissieux | Difference |
|---|---|---|---|
| Mayor | Gilles Gascon | Idir Boumertit | |
| Political label of the mayor’s list (2026 local elections) | Les Républicains | La France insoumise | |
| Premises with fiberBetter covered: Saint-Priest+6.5 pts | 99% | 92% | Better covered: Saint-Priest+6.5 pts |
Sources: Ministry of the Interior, register of elected officials, Ministry of the Interior, Arcep
Shops and facilities
Shops, leisure and transportation
| Criterion | Saint-Priest | Vénissieux | Difference |
|---|---|---|---|
| Shops per 10,000 inhab.More shops per capita: Saint-Priest2.5 times as high | 68.9341 in total | 28.0184 in total | More shops per capita: Saint-Priest2.5 times as high |
| Food shops per 10,000 inhab.More per capita: Saint-Priest2.2 times as high | 22.6112 in total | 10.569 in total | More per capita: Saint-Priest2.2 times as high |
| Restaurants per 10,000 inhab.More per capita: Saint-Priest+0.8% | 28.1139 in total | 27.9183 in total | More per capita: Saint-Priest+0.8% |
| Sports facilities per 10,000 inhab.More per capita: Vénissieux+13% | 9.748 in total | 11.072 in total | More per capita: Vénissieux+13% |
| Cultural venues per 10,000 inhab.More per capita: Vénissieux+5% | 1.05 in total | 1.17 in total | More per capita: Vénissieux+5% |
| Hotels per 10,000 inhab.More per capita: Saint-Priest3.5 times as high | 2.613 in total | 0.85 in total | More per capita: Saint-Priest3.5 times as high |
| Passenger train stationsTie | 1 | 1 | Tie |
Number of facilities per 10,000 inhabitants (total count in small print). Source: INSEE, facilities database (BPE)
Health
Health care
| Criterion | Saint-Priest | Vénissieux | Difference |
|---|---|---|---|
| Access to general practitioners visits/inhab./year localized potential accessibilityBetter access: Vénissieux+55% | 3.0 | 4.7 | Better access: Vénissieux+55% |
| General practitioners per 10,000 inhab.More per capita: Saint-Priest+9% | 9.145 in total | 8.455 in total | More per capita: Saint-Priest+9% |
| Medical specialists per 10,000 inhab.More per capita: Saint-Priest+47% | 24.6122 in total | 16.7110 in total | More per capita: Saint-Priest+47% |
| Dentists per 10,000 inhab.More per capita: Saint-Priest+87% | 6.331 in total | 3.322 in total | More per capita: Saint-Priest+87% |
| Pharmacies per 10,000 inhab.More per capita: Vénissieux+2% | 2.814 in total | 2.919 in total | More per capita: Vénissieux+2% |
| HospitalsMore facilities: Vénissieux+2 | 3 | 5 | More facilities: Vénissieux+2 |
Practitioners and facilities per 10,000 inhabitants (total count in small print); access to doctors includes those in neighboring communes. Sources: Ministry of Health (DREES), APL, INSEE, facilities database (BPE), Ministry of Health (Finess)
Education
Schools and colleges
| Criterion | Saint-Priest | Vénissieux | Difference |
|---|---|---|---|
| Primary schoolsMore schools: Vénissieux+16 | 24 | 40 | More schools: Vénissieux+16 |
| Middle schoolsMore middle schools: Vénissieux+3 | 7 | 10 | More middle schools: Vénissieux+3 |
| High schoolsMore high schools: Vénissieux+3 | 2 | 5 | More high schools: Vénissieux+3 |
| Higher education institutions and programsTie | 1 | 1 | Tie |
Sources: Ministry of Education, INSEE, facilities database (BPE)
Recorded crime
Offenses recorded by the police
| Criterion | Saint-Priest | Vénissieux | Difference |
|---|---|---|---|
| Home burglaries per 1,000 homesHigher rate: Vénissieux+8% | 5.8 | 6.2 | Higher rate: Vénissieux+8% |
| Non-violent thefts per 1,000 inhab.Higher rate: Vénissieux+64% | 10.2 | 16.7 | Higher rate: Vénissieux+64% |
| Physical violence outside the family per 1,000 inhab.Higher rate: Vénissieux+86% | 3.4 | 6.4 | Higher rate: Vénissieux+86% |
| Vehicle thefts per 1,000 inhab.Higher rate: Vénissieux+9% | 3.9 | 4.2 | Higher rate: Vénissieux+9% |
| Vandalism and property damage per 1,000 inhab.Higher rate: Vénissieux+25% | 12.8 | 16.0 | Higher rate: Vénissieux+25% |
Offenses recorded in the commune by the police and gendarmerie, per 1,000 inhabitants (per 1,000 homes for burglaries); this is not the actual crime level. Rates for the latest published year. Source: Ministry of the Interior (SSMSI)
Natural hazards
Natural disasters and prevention
| Criterion | Saint-Priest | Vénissieux | Difference |
|---|---|---|---|
| Natural disasters declared since 1982More declarations: Saint-Priest+3 | 14 | 11 | More declarations: Saint-Priest+3 |
| Natural hazard prevention plansTie | 0 | 0 | Tie |
| Radon potentialSame | Low | Low | Same |
Sources: Géorisques (GASPAR), IRSN
Land
Area, terrain and administrative areas
| Criterion | Saint-Priest | Vénissieux | Difference |
|---|---|---|---|
| Area km²Larger: Saint-Priest+94% | 29.7 | 15.3 | Larger: Saint-Priest+94% |
| Town hall elevationHigher: Saint-Priest+17 m | 206 m | 189 m | Higher: Saint-Priest+17 m |
| Coastal communeSame | No | No | Same |
| Density grid (INSEE)Same | Large urban centre | Large urban centre | Same |
| DepartmentSame | Rhône (69) | Rhône (69) | Same |
| IntercommunalitySame | Métropole de Lyon | Métropole de Lyon | Same |
| Urban unitSame | Lyon | Lyon | Same |
| Functional areaSame | Lyon | Lyon | Same |
Sources: IGN, IGN, elevation, Ministry for the Ecological Transition, Loi Littoral, INSEE, density grid, INSEE, COG, INSEE, geographic classifications
Summary
Saint-Priest (69) vs Vénissieux at a glance
| Criterion | Saint-Priest | Vénissieux |
|---|---|---|
| Population inhab. | 49,498 | 65,689 |
| Change over 10 years | +14.6% | +6.3% |
| Density per km² | 1,666 | 4,285 |
| Median apartment price €/m² | 3,057 | 2,846 |
| Median house price €/m² | 3,990 | 3,598 |
| Apartment rent €/m² | 15.1 | 14.7 |
| Property tax (combined rate) | 36.15% | 37.18% |
| Median standard of living €/year | 24,110 | 18,980 |
| Unemployment rate (census) | 12.5% | 18.8% |
| Premises with fiber | 99% | 92% |
| Access to general practitioners visits/inhab./year | 3.0 | 4.7 |
| Home burglaries per 1,000 homes | 5.8 | 6.2 |
| Average temperature | 13.0°C | 13.0°C |
| Sunshine h/year | 2,050 | 2,050 |
| Area km² | 29.7 | 15.3 |
More comparisons
Compare with other towns
FAQ
Saint-Priest (69) vs Vénissieux: your questions
Which is the larger city, Saint-Priest or Vénissieux?
By population, Vénissieux: 65,689 inhabitants versus 49,498 for Saint-Priest (official population figures in force on January 1, 2026). Vénissieux is the 83rd largest city in France, Saint-Priest the 137th. By area, Saint-Priest is the larger (29.7 km²).
How far is Saint-Priest from Vénissieux?
Saint-Priest and Vénissieux are 5.2 km apart as the crow flies, between the centers of the two communes, in the same department (Rhône).
Where is real estate more expensive, in Saint-Priest or Vénissieux?
To buy an apartment, Saint-Priest is more expensive: €3,057 per m² (median price), versus €2,846 in Vénissieux (+7%). Median prices of sales over the last five years (DGFiP, DVF).
Where is the standard of living higher, in Saint-Priest or Vénissieux?
In Saint-Priest, half of the residents have a standard of living above €24,110 a year, versus €18,980 in Vénissieux (disposable income per consumption unit, INSEE).
Are Saint-Priest and Vénissieux in the same department?
Yes: both towns are in Rhône (69), in the Auvergne-Rhône-Alpes region.
Official population figures in force on January 1, 2026. Source: INSEE, official population figures