2026 comparison
Orléans vs Saint-Paul (974): 2026 comparison
Orléans has more inhabitants than Saint-Paul: 118,788 versus 109,405, or 8.6% more. Saint-Paul covers a larger area (241 km² versus 27.5 km²), but Orléans is more densely populated: 4,323 inhabitants per km² versus 453.
The median apartment price is higher in Saint-Paul: €4,809 per m² versus €2,577. The median standard of living is higher in Orléans (€23,630 a year versus €21,220).
The two cities are 9,326 km apart as the crow flies.
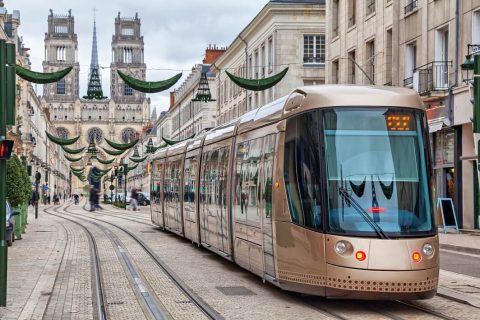
Orléans
City in Loiret
- Population
- 118,788 inhab.
- 36th in France · 1st in its department
- Area
- 27.5 km²
- Density
- 4,323 per km²
Saint-Paul
City in Réunion
- Population
- 109,405 inhab.
- 39th in France · 2nd in its department
- Area
- 241 km²
- Density
- 453 per km²
Population
Population and demographics
Municipal population since 1954
OrléansSaint-Paul
| Criterion | Orléans | Saint-Paul | Difference |
|---|---|---|---|
| Population inhab.More populous: Orléans+9% | 118,788 | 109,405 | More populous: Orléans+9% |
| Change over 5 yearsStronger growth: Saint-Paul+4.3 pts | +0.1% | +4.4% | Stronger growth: Saint-Paul+4.3 pts |
| Change over 10 yearsStronger growth: Saint-Paul+1.9 pt | +1.7% | +3.6% | Stronger growth: Saint-Paul+1.9 pt |
| Density per km²Denser: Orléans9.5 times as high | 4,323 | 453 | Denser: Orléans9.5 times as high |
| Under 15More young people: Saint-Paul+2.3 pts | 17.4% | 19.6% | More young people: Saint-Paul+2.3 pts |
| 65 and overMore seniors: Orléans+2.1 pts | 16.8% | 14.7% | More seniors: Orléans+2.1 pts |
| People per householdLarger households: Saint-Paul+0.56 | 1.95 | 2.51 | Larger households: Saint-Paul+0.56 |
Sources: INSEE, official population figures, INSEE, censuses, INSEE, census
Housing
Real estate prices and housing
| Criterion | Orléans | Saint-Paul | Difference |
|---|---|---|---|
| Median apartment price €/m²More expensive: Saint-Paul+87% | 2,577 | 4,809 | More expensive: Saint-Paul+87% |
| Median house price €/m²More expensive: Saint-Paul+48% | 2,634 | 3,891 | More expensive: Saint-Paul+48% |
| Apartment rent €/m² per month, utilities includedMore expensive: Saint-Paul+32% | 14.3 | 18.9 | More expensive: Saint-Paul+32% |
| House rent €/m² per month, utilities includedMore expensive: Saint-Paul+36% | 11.5 | 15.6 | More expensive: Saint-Paul+36% |
| Homeowner householdsMore homeowners: Saint-Paul+24 pts | 36.6% | 61.0% | More homeowners: Saint-Paul+24 pts |
| Share of housesMore houses: Saint-Paul+49 pts | 22.8% | 71.8% | More houses: Saint-Paul+49 pts |
| Social housing (SRU law) share of primary residencesMore social housing: Orléans+9.0 pts | 27.4% | 18.3% | More social housing: Orléans+9.0 pts |
| Second homesMore second homes: Saint-Paul+3.2 pts | 4.0% | 7.3% | More second homes: Saint-Paul+3.2 pts |
| Vacant homesMore vacant homes: Orléans+0.9 pt | 10.3% | 9.4% | More vacant homes: Orléans+0.9 pt |
| Property tax (combined rate)Higher rate: Orléans+11 pts | 54.70% | 43.28% | Higher rate: Orléans+11 pts |
Sources: DGFiP (DVF), Ministry of Housing (rent map), INSEE, census, Ministry for the Ecological Transition (SRU), DGFiP, local taxation
Income and jobs
Residents’ income and jobs
| Criterion | Orléans | Saint-Paul | Difference |
|---|---|---|---|
| Median standard of living €/yearHigher: Orléans+11% | 23,630 | 21,220 | Higher: Orléans+11% |
| Poverty rateHigher: Saint-Paul+7.1 pts | 23.3% | 30.4% | Higher: Saint-Paul+7.1 pts |
| Average taxable income per householdHigher: Orléans+13% | €29,200 | €25,928 | Higher: Orléans+13% |
| Households paying income taxMore taxpaying households: Orléans+19 pts | 47% | 28% | More taxpaying households: Orléans+19 pts |
| Activity rate (ages 15-64)Higher: Orléans+3.6 pts | 73.8% | 70.2% | Higher: Orléans+3.6 pts |
| Unemployment rate (census)Higher: Saint-Paul+9.3 pts | 14.6% | 23.9% | Higher: Saint-Paul+9.3 pts |
Sources: INSEE, Filosofi, DGFiP, income tax, INSEE, census
Local life
Town hall and fiber internet
| Criterion | Orléans | Saint-Paul | Difference |
|---|---|---|---|
| Mayor | Serge Grouard | Emmanuel Séraphin | |
| Political label of the mayor’s list (2026 local elections) | miscellaneous right | union of the left | |
| Premises with fiberBetter covered: Saint-Paul+3.6 pts | 92% | 95% | Better covered: Saint-Paul+3.6 pts |
Sources: Ministry of the Interior, register of elected officials, Ministry of the Interior, Arcep
Shops and facilities
Shops, leisure and transportation
| Criterion | Orléans | Saint-Paul | Difference |
|---|---|---|---|
| Shops per 10,000 inhab.More shops per capita: Saint-Paul+9% | 63.3752 in total | 69.3758 in total | More shops per capita: Saint-Paul+9% |
| Food shops per 10,000 inhab.More per capita: Saint-Paul+40% | 17.9213 in total | 25.0274 in total | More per capita: Saint-Paul+40% |
| Restaurants per 10,000 inhab.More per capita: Saint-Paul+51% | 35.5422 in total | 53.7588 in total | More per capita: Saint-Paul+51% |
| Sports facilities per 10,000 inhab.More per capita: Saint-Paul+80% | 13.6162 in total | 24.6269 in total | More per capita: Saint-Paul+80% |
| Cultural venues per 10,000 inhab.More per capita: Orléans+100% | 2.226 in total | 1.112 in total | More per capita: Orléans+100% |
| Hotels per 10,000 inhab.More per capita: Saint-Paul+61% | 2.125 in total | 3.437 in total | More per capita: Saint-Paul+61% |
| Passenger train stationsMore stations: Orléans+1 | 1 | 0 | More stations: Orléans+1 |
Number of facilities per 10,000 inhabitants (total count in small print). Source: INSEE, facilities database (BPE)
Health
Health care
| Criterion | Orléans | Saint-Paul | Difference |
|---|---|---|---|
| Access to general practitioners visits/inhab./year localized potential accessibilityBetter access: Saint-Paul2.2 times as high | 3.0 | 6.8 | Better access: Saint-Paul2.2 times as high |
| General practitioners per 10,000 inhab.More per capita: Saint-Paul+81% | 7.184 in total | 12.8140 in total | More per capita: Saint-Paul+81% |
| Medical specialists per 10,000 inhab.More per capita: Saint-Paul+56% | 10.7127 in total | 16.6182 in total | More per capita: Saint-Paul+56% |
| Dentists per 10,000 inhab.More per capita: Saint-Paul+20% | 8.196 in total | 9.7106 in total | More per capita: Saint-Paul+20% |
| Pharmacies per 10,000 inhab.More per capita: Saint-Paul+30% | 2.125 in total | 2.730 in total | More per capita: Saint-Paul+30% |
| HospitalsMore facilities: Orléans+2 | 8 | 6 | More facilities: Orléans+2 |
Practitioners and facilities per 10,000 inhabitants (total count in small print); access to doctors includes those in neighboring communes. Sources: Ministry of Health (DREES), APL, INSEE, facilities database (BPE), Ministry of Health (Finess)
Education
Schools and colleges
| Criterion | Orléans | Saint-Paul | Difference |
|---|---|---|---|
| Primary schoolsTie | 69 | 69 | Tie |
| Middle schoolsMore middle schools: Orléans+3 | 18 | 15 | More middle schools: Orléans+3 |
| High schoolsMore high schools: Orléans+8 | 17 | 9 | More high schools: Orléans+8 |
| Higher education institutions and programsMore facilities: Orléans+27 | 28 | 1 | More facilities: Orléans+27 |
Sources: Ministry of Education, INSEE, facilities database (BPE)
Recorded crime
Offenses recorded by the police
| Criterion | Orléans | Saint-Paul | Difference |
|---|---|---|---|
| Home burglaries per 1,000 homesHigher rate: Orléans+95% | 3.2 | 1.6 | Higher rate: Orléans+95% |
| Non-violent thefts per 1,000 inhab.Higher rate: Orléans+67% | 11.1 | 6.7 | Higher rate: Orléans+67% |
| Physical violence outside the family per 1,000 inhab.Higher rate: Orléans+22% | 5.3 | 4.4 | Higher rate: Orléans+22% |
| Vehicle thefts per 1,000 inhab.Higher rate: Saint-Paul2.6 times as high | 0.7 | 1.8 | Higher rate: Saint-Paul2.6 times as high |
| Vandalism and property damage per 1,000 inhab.Higher rate: Orléans+11% | 7.2 | 6.5 | Higher rate: Orléans+11% |
Offenses recorded in the commune by the police and gendarmerie, per 1,000 inhabitants (per 1,000 homes for burglaries); this is not the actual crime level. Rates for the latest published year. Source: Ministry of the Interior (SSMSI)
Climate
Temperature, sunshine and rain
| Criterion | Orléans | Saint-Paul | Difference |
|---|---|---|---|
| Average temperatureWarmer: Saint-Paul+12.7 °C | 11.7°C | 24.4°C | Warmer: Saint-Paul+12.7 °C |
| Sunshine h/yearSunnier: Saint-Paul+41% | 1,823 | 2,567 | Sunnier: Saint-Paul+41% |
| Rainfall mm/yearWetter: Orléans+22% | 729 | 598 | Wetter: Orléans+22% |
| Rainy days days/year at least 1 mmMore rainy days: Orléans+69 days/year | 117 | 48 | More rainy days: Orléans+69 days/year |
| Frost days days/yearMore frost days: Orléans+55 days/year | 55 | 0 | More frost days: Orléans+55 days/year |
| Very hot days days/year 30 °C or moreMore hot days: Saint-Paul+132 days/year | 17 | 149 | More hot days: Saint-Paul+132 days/year |
Climate normals from the reference Météo-France station of each commune. Source: Météo-France, climate normals
Natural hazards
Natural disasters and prevention
| Criterion | Orléans | Saint-Paul | Difference |
|---|---|---|---|
| Natural disasters declared since 1982More declarations: Saint-Paul+5 | 19 | 24 | More declarations: Saint-Paul+5 |
| Natural hazard prevention plansMore plans: Saint-Paul+1 | 1 | 2 | More plans: Saint-Paul+1 |
| Radon potentialSame | Low | Low | Same |
Sources: Géorisques (GASPAR), IRSN
Land
Area, terrain and administrative areas
| Criterion | Orléans | Saint-Paul | Difference |
|---|---|---|---|
| Area km²Larger: Saint-Paul8.8 times as high | 27.5 | 241 | Larger: Saint-Paul8.8 times as high |
| Town hall elevationHigher: Orléans+106 m | 112 m | 5 m | Higher: Orléans+106 m |
| Coastal commune | No | Yes (sea) | |
| Density grid (INSEE) | Large urban centre | Intermediate urban centre | |
| Department | Loiret (45) | Réunion (974) | |
| Intercommunality | Orléans Métropole | Communauté d'agglomération Territoire de la Côte Ouest (TCO) | |
| Urban unit | Orléans | Saint-Paul | |
| Functional area | Orléans | Saint-Paul |
Sources: IGN, IGN, elevation, Ministry for the Ecological Transition, Loi Littoral, INSEE, density grid, INSEE, COG, INSEE, geographic classifications
Summary
Orléans vs Saint-Paul (974) at a glance
| Criterion | Orléans | Saint-Paul |
|---|---|---|
| Population inhab. | 118,788 | 109,405 |
| Change over 10 years | +1.7% | +3.6% |
| Density per km² | 4,323 | 453 |
| Median apartment price €/m² | 2,577 | 4,809 |
| Median house price €/m² | 2,634 | 3,891 |
| Apartment rent €/m² | 14.3 | 18.9 |
| Property tax (combined rate) | 54.70% | 43.28% |
| Median standard of living €/year | 23,630 | 21,220 |
| Unemployment rate (census) | 14.6% | 23.9% |
| Premises with fiber | 92% | 95% |
| Access to general practitioners visits/inhab./year | 3.0 | 6.8 |
| Home burglaries per 1,000 homes | 3.2 | 1.6 |
| Average temperature | 11.7°C | 24.4°C |
| Sunshine h/year | 1,823 | 2,567 |
| Area km² | 27.5 | 241 |
More comparisons
Compare with other towns
FAQ
Orléans vs Saint-Paul (974): your questions
Which is the larger city, Orléans or Saint-Paul?
By population, Orléans: 118,788 inhabitants versus 109,405 for Saint-Paul (official population figures in force on January 1, 2026). Orléans is the 36th largest city in France, Saint-Paul the 39th. By area, Saint-Paul is the larger (241 km²).
How far is Orléans from Saint-Paul?
Orléans and Saint-Paul are 9,326 km apart as the crow flies, between the centers of the two communes.
Where is real estate more expensive, in Orléans or Saint-Paul?
To buy an apartment, Saint-Paul is more expensive: €4,809 per m² (median price), versus €2,577 in Orléans (+87%). Median prices of sales over the last five years (DGFiP, DVF).
Where is the standard of living higher, in Orléans or Saint-Paul?
In Orléans, half of the residents have a standard of living above €23,630 a year, versus €21,220 in Saint-Paul (disposable income per consumption unit, INSEE).
Which city is sunnier, Orléans or Saint-Paul?
Saint-Paul: 2,567 hours of sunshine a year on average, versus 1,823 in Orléans (climate normals from the reference Météo-France station of each town).
Official population figures in force on January 1, 2026. Source: INSEE, official population figures