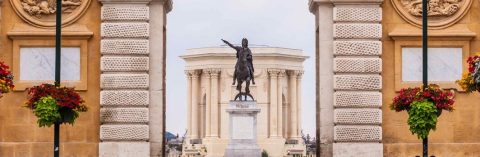
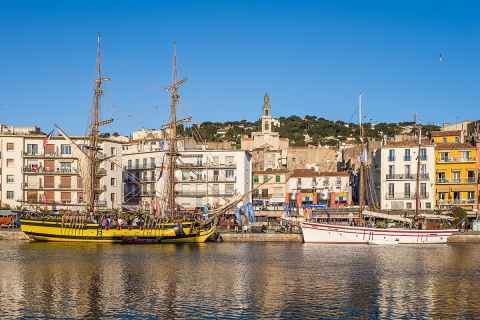
The largest city in the Hérault department is Montpellier, with 313,712 inhabitants (ranked 7th in France by population). The largest town by area is Béziers (95 km²). Montpellier is also the most densely populated town, with 5,515 inhabitants per km². At the other end of the ranking, Romiguières has only 25 inhabitants.
The Hérault department has 1,248,501 inhabitants over 6,101 km², a density of 205 inhabitants per km², 1.9 times the national average (110 per km²). It accounts for 20.0% of the population of Occitanie, the region it has belonged to since the 2016 reform (formerly Languedoc-Roussillon): see the ranking of the largest cities in Occitanie.
The 20 largest cities in the Hérault department by population
| Rank | Town | Population | km² | per km² | Proportional bar | France rank |
|---|---|---|---|---|---|---|
| 1 | Montpellier | 313,712 | 57 | 5,515 | 7th | |
| 2 | Béziers | 82,629 | 95 | 865 | 61st | |
| 3 | Sète | 45,901 | 24 | 1,896 | 161st | |
| 4 | Agde | 30,340 | 51 | 597 | 289th | |
| 5 | Lunel | 26,923 | 24 | 1,126 | 340th | |
| 6 | Castelnau-le-Lez | 26,449 | 11 | 2,366 | 351st | |
| 7 | Frontignan | 24,383 | 32 | 769 | 378th | |
| 8 | Lattes | 17,540 | 28 | 630 | 573rd | |
| 9 | Mauguio | 16,695 | 50 | 337 | 599th | |
| 10 | Juvignac | 14,181 | 11 | 1,309 | 718th | |
| 11 | Saint-Jean-de-Védas | 13,476 | 13 | 1,045 | 758th | |
| 12 | Mèze | 12,862 | 35 | 372 | 794th | |
| 13 | Villeneuve-lès-Maguelone | 11,010 | 23 | 485 | 952nd | |
| 14 | Saint-Gély-du-Fesc | 10,732 | 17 | 650 | 981st | |
| 15 | Pérols | 9,758 | 6.0 | 1,624 | 1,100th | |
| 16 | Clermont-l'Hérault | 9,607 | 32 | 296 | 1,126th | |
| 17 | Le Crès | 9,365 | 5.8 | 1,604 | 1,160th | |
| 18 | Grabels | 9,188 | 16 | 566 | 1,179th | |
| 19 | Sérignan | 8,772 | 27 | 320 | 1,240th | |
| 20 | Pignan | 8,526 | 20 | 420 | 1,283rd |
Largest towns by area in the Hérault department
| Rank | Town | Population | km² | per km² | Proportional bar | France rank |
|---|---|---|---|---|---|---|
| 1 | Béziers | 82,629 | 95 | 865 | 265th | |
| 2 | La Salvetat-sur-Agout | 1,117 | 88 | 13 | 322nd | |
| 3 | Saint-Maurice-Navacelles | 190 | 69 | 3 | 565th | |
| 4 | Lunas-les-Châteaux | 849 | 64 | 13 | 679th | |
| 5 | Avène | 299 | 63 | 5 | 707th | |
| 6 | Fraisse-sur-Agout | 328 | 58 | 6 | 811th | |
| 7 | Aumelas | 636 | 58 | 11 | 818th | |
| 8 | Montpellier | 313,712 | 57 | 5,515 | 870th | |
| 9 | Riols | 732 | 56 | 13 | 901st | |
| 10 | Rosis | 285 | 53 | 5 | 1,024th |
Most densely populated towns in the Hérault department
| Rank | Town | Population | km² | per km² | Proportional bar | France rank |
|---|---|---|---|---|---|---|
| 1 | Montpellier | 313,712 | 57 | 5,515 | 121st | |
| 2 | Palavas-les-Flots | 6,176 | 2.4 | 2,595 | 350th | |
| 3 | Castelnau-le-Lez | 26,449 | 11 | 2,366 | 384th | |
| 4 | Jacou | 7,063 | 3.4 | 2,059 | 440th | |
| 5 | Valras-Plage | 4,489 | 2.4 | 1,910 | 481st | |
| 6 | Sète | 45,901 | 24 | 1,896 | 482nd | |
| 7 | Pérols | 9,758 | 6.0 | 1,624 | 578th | |
| 8 | Le Crès | 9,365 | 5.8 | 1,604 | 584th | |
| 9 | Juvignac | 14,181 | 11 | 1,309 | 730th | |
| 10 | Lunel | 26,923 | 24 | 1,126 | 856th |
Hérault in figures
Official data compared with the Occitanie region and France.
Population since 1968
Municipal population at the latest census: 1,230,289, +13% over ten years and +108% since 1968 (France: +34%).
Compared growth
Index 100 in 1968
Municipal population at each census, current municipal boundaries; France excluding Mayotte. Source: INSEE, population censuses
Age of residents
People aged 65 and over make up 22.7% of the population (France: 21.2%), under-15s 15.8%.
| Hérault | Region | France | |
|---|---|---|---|
| Under 15 | 15.8% | 15.7% | 17.0% |
| 15–24 | 13.0% | 11.6% | 11.9% |
| 25–39 | 17.7% | 16.8% | 17.9% |
| 40–54 | 18.5% | 19.0% | 19.2% |
| 55–64 | 12.3% | 13.1% | 12.7% |
| 65–79 | 16.2% | 16.8% | 15.1% |
| 80 and over | 6.5% | 7.0% | 6.1% |
Town shares weighted by municipal population; France excluding Mayotte. Source: INSEE, population census
Housing
About 782,278 dwellings, 17.2% of them second homes (France: 9.7%).
| Hérault | Region | France | |
|---|---|---|---|
| Main residences | 76.0% | 77.1% | 82.4% |
| Second homes | 17.2% | 15.0% | 9.7% |
| Vacant dwellings | 6.7% | 7.9% | 7.8% |
| Houses | 46.9% | 60.0% | 54.7% |
| Apartments | 52.1% | 39.1% | 44.3% |
| Owner-occupiers | 53.0% | 58.8% | 57.5% |
| Tenants | 44.6% | 38.8% | 40.3% |
| of which social housing | 10.7% | 9.4% | 14.6% |
Towns in Occitanie with the highest share of second homesTowns in Occitanie with the highest share of social housing
Shares of all dwellings (tenure: shares of main residences). Source: INSEE, population census
Property prices
Apartments sell for a median €3,375 per m², in line with France.
| Hérault | France | |
|---|---|---|
| Apartment | €3,375 | €3,374 |
| House | €2,971 | €2,143 |
Across the region, the median price of apartments ranges from €1,490 (Lozère) to €3,375 (Hérault) per m²; no regional median is published.
Most expensive cities in OccitanieTowns in Occitanie where houses are most expensive
Median price per m² of apartment and house sales over the last five years; France excluding Alsace-Moselle and Mayotte. Source: DGFiP, land value requests (DVF)
Income
Half of the residents have a standard of living above €24,280 a year (disposable income per consumption unit).
| Hérault | Region | Metro. France | |
|---|---|---|---|
| Median standard of living | €24,280 | €24,650 | €25,920 |
| Poverty rate | 21.0% | 18.6% | 15.9% |
Richest towns in OccitanieRichest cities in Occitanie
Values published by INSEE for each area. Source: INSEE, Filosofi
Employment
| Hérault | Region | France | |
|---|---|---|---|
| Unemployment rate | 14.5% | 12.5% | 11.4% |
| Activity rate | 72.9% | 74.5% | 75.6% |
Towns in Occitanie with the highest unemployment rate
Unemployment as reported in the census, which differs from the quarterly ILO rate. Source: INSEE, population census
Recorded crime
Offences recorded by the police and gendarmerie over one year, per 1,000 inhabitants (* per 1,000 dwellings).
| Hérault | Region | France | |
|---|---|---|---|
| Physical violence outside the family | 3.8 | 3.1 | 3.2 |
| Domestic physical violence | 3.5 | 3.3 | 3.8 |
| Sexual violence | 1.8 | 1.8 | 1.9 |
| Non-violent theft from persons | 12.9 | 8.8 | 9.1 |
| Residential burglaries* | 6.3 | 6.0 | 5.6 |
| Vehicle thefts | 2.1 | 1.7 | 1.8 |
| Criminal damage | 10.4 | 8.4 | 7.9 |
| Fraud | 7.7 | 7.0 | 6.5 |
Towns in Occitanie with the highest recorded burglary rateTowns in Occitanie with the highest recorded rate of physical violence outside the family
Values published for each area; they do not measure all crime (reporting, police activity). Source: Ministry of the Interior, SSMSI
Health
| Hérault | Region | France | |
|---|---|---|---|
| Access to general practitionersconsultations per year per inhabitant | 4.4 | 3.9 | 3.7 |
| Access to dentistsFTE per 100,000 inhabitants | 76 | 68 | 62 |
| Access to nursesFTE per 100,000 inhabitants | 240 | 205 | 154 |
| Access to physiotherapistsFTE per 100,000 inhabitants | 233 | 174 | 124 |
| General practitionersper 10,000 inhabitants | 11.7 | 9.6 | 9.0 |
| Pharmaciesper 10,000 inhabitants | 3.1 | 3.1 | 3.0 |
| Hospital sitesper 100,000 inhabitants | 8.5 | 9.2 | 7.8 |
Medical deserts: the towns in Occitanie with the poorest access to general practitioners
Accessibility: average of towns weighted by population; France excluding Mayotte. Sources: DREES, localized potential accessibility, INSEE, BPE, FINESS
Shops and facilities
66,139 facilities and services listed, 538 per 10,000 inhabitants (France: 427).
| Per 10,000 inhabitants | ||||
|---|---|---|---|---|
| Number | Hérault | Region | France | |
| Supermarkets | 243 | 2.0 | 2.3 | 2.2 |
| Bakeries | 964 | 7.8 | 7.8 | 7.3 |
| Restaurants | 6,255 | 50.8 | 40.3 | 33.9 |
| Hotels | 295 | 2.4 | 2.9 | 2.5 |
| Post offices | 260 | 2.1 | 3.2 | 2.5 |
| Passenger stations | 21 | 0.2 | 0.4 | 0.4 |
| Sports facilities | 2,815 | 22.9 | 32.7 | 27.8 |
| Cultural venues | 379 | 3.1 | 4.3 | 3.4 |
Schools
| Private share | |||
|---|---|---|---|
| Hérault | Region | France | |
| Primary schools680 open | 12% | 10% | 12% |
| Lower secondary schools142 open | 24% | 26% | 25% |
| Upper secondary schools101 open | 43% | 42% | 39% |
Climate
Across its 26 weather stations, the mean annual temperature ranges from 9.7 °C (Cambon-et-Salvergues, 955 m) to 15.9 °C (Sète, 75 m).
| Hérault | Region | Metro. France | |
|---|---|---|---|
| Mean temperature | 9.7–15.9 °C | 5.7–17.3 °C | 2.8–17.5 °C |
| Precipitation | 518–1,688 mm | 518–1,970 mm | 474–2,282 mm |
| Sunshine | 2,705 hMauguio – Montpellier-Aeroport, 1 m | 1,960–2,705 h | 1,463–2,898 h |
| Days at 30 °C or more | 5–65 d | 0–71 d | 0–81 d |
| Frost days | 5–77 d | 4–144 d | 0–204 d |
Sunniest cities in OccitanieSunniest large cities in Occitanie
Thirty-year normals of the stations in the area, without interpolation. Source: Météo-France, climate normals
Natural disasters
3,751 recognitions of a state of natural disaster since 1982 in its towns, the latest for an event on December 18, 2025.
| Per town, on average | |||
|---|---|---|---|
| Hérault | Region | France | |
| All recognitions | 11.0 | 9.5 | 7.1 |
| Floods and mudslides | 7.8 | 5.4 | 4.2 |
| Drought (clay shrinkage) | 2.0 | 2.3 | 1.2 |
| Ground movements | 0.3 | 0.6 | 1.0 |
| Storms, hail, snow | 1.0 | 1.1 | 0.6 |
| Earthquakes | 0.0 | 0.0 | 0.0 |
Towns in Occitanie with the most officially recognized natural disasters
One recognition per town, event and hazard. Source: Géorisques, GASPAR database
Towns by size
| Share of towns | ||||
|---|---|---|---|---|
| Towns | Hérault | Region | France | |
| Under 500 | 117 | 34.3% | 62.4% | 51.7% |
| 500–1,999 | 108 | 31.7% | 25.2% | 32.2% |
| 2,000–4,999 | 67 | 19.6% | 7.8% | 9.5% |
| 5,000–9,999 | 35 | 10.3% | 2.9% | 3.5% |
| 10,000–49,999 | 12 | 3.5% | 1.6% | 2.7% |
| 50,000 and over | 2 | 0.6% | 0.2% | 0.4% |
Sources: INSEE, official populations, INSEE, official geographic code
Political label of mayors’ lists
Political label assigned by the Ministry of the Interior to the list of the mayor elected in March 2026, in the 70 towns where one is assigned (3,500 inhabitants or more, and sub-prefectures).
| Share of towns | ||||
|---|---|---|---|---|
| Towns | Hérault | Region | France | |
| Miscellaneous right (Divers droite) LDVD | 23 | 33% | 27% | 34% |
| Miscellaneous left (Divers gauche) LDVG | 17 | 24% | 25% | 18% |
| Miscellaneous (Divers) LDIV | 15 | 21% | 21% | 17% |
| Miscellaneous center (Divers centre) LDVC | 7 | 10% | 14% | 17% |
| Union of the Left (Union de la gauche) LUG | 2 | 3% | 4% | 4% |
| Union of the Right (Union de la droite) LUD | 2 | 3% | 1% | 1% |
| National Rally (Rassemblement national) LRN | 1 | 1% | 3% | 1% |
| Socialist Party (Parti socialiste) LSOC | 1 | 1% | 2% | 1% |
| Other labelsLUDI, LVEC | 2 | 3% | 1% | 0% |
The label is assigned by the ministry and may differ from the one chosen by the candidates. Sources: Ministry of the Interior, 2026 municipal elections, National register of elected officials
Town finances
Main budget of the towns for the latest fiscal year published, in euros per inhabitant.
| Hérault | Region | France | |
|---|---|---|---|
| Debtoutstanding on December 31 | €1,168 | €895 | €993 |
| Local taxes | €798 | €604 | €639 |
| Capital spending | €519 | €470 | €463 |
Most indebted towns in OccitanieMost indebted cities in Occitanie
Total of the towns’ amounts divided by their total DGF population; intercommunalities not included. Source: DGFiP (French public finance directorate), individual accounts of communes
Tourism
279 hotels and 209 campgrounds, with 56,071 rooms and campsites in all: 4.5 per 100 inhabitants (France: 2.2).
| Per 10,000 inhabitants | ||||
|---|---|---|---|---|
| Number | Hérault | Region | France | |
| Hotels | 279 | 2.2 | 2.8 | 2.3 |
| Hotel rooms | 10,535 | 84.4 | 94.2 | 94.9 |
| Campgrounds | 209 | 1.7 | 2.1 | 1.1 |
| Campsites | 45,536 | 364.7 | 245.9 | 121.9 |
Most touristic towns in OccitanieTowns in Occitanie with the most hotel rooms and campsites
Establishments open on January 1, rated or not. Source: INSEE, tourist accommodation capacity of communes
Vacant homes
43,190 vacant homes in the private housing stock of the towns whose figures are published.
| Hérault | Region | France | |
|---|---|---|---|
| Vacant homes | 6.4% | 7.6% | 7.1% |
| Vacant for more than two years | 3.2% | 4.1% | 3.9% |
Towns in Occitanie with the highest housing vacancy rate
Towns whose figures are published (tax confidentiality covers those with fewer than 11 vacant homes); all vacancy on January 1, including short spells. Source: Ministry of Housing and Cerema, LOVAC
Historic monuments
| Hérault | Region | France | |
|---|---|---|---|
| Historic monuments | 611 | 5,070 | 46,704 |
| of which classified | 185 | 1,501 | 14,964 |
| Per 10,000 inhabitants | 4.9 | 8.1 | 6.7 |
| Towns with at least one | 58% | 43% | 47% |
Towns in Occitanie with the most historic monuments
Classified or registered buildings; a monument that spans several towns counts only once. Source: Ministry of Culture, Mérimée database
Train stations
21 passenger stations, which together handle 16,157,884 passengers a year. The busiest: Montpellier Saint-Roch (7,534,414), Montpellier Sud de France (2,514,013), Béziers (1,693,346).
Busiest train stations in Occitanie
Source: SNCF Gares & Connexions. SNCF data, ODbL license.
Elections
In the second round of the 2022 presidential election, Emmanuel Macron came first in Hérault with 52.6% of the valid votes in its towns (France: Emmanuel Macron, 58.1%).
| Turnout | |||
|---|---|---|---|
| Hérault | Region | France | |
| 2022 presidential, 1st round | 76.9% | 78.2% | 75.3% |
| 2022 presidential, 2nd round | 73.4% | 75.2% | 73.3% |
| 2024 legislative, 1st round | 69.3% | 70.8% | 67.9% |
| 2024 European | 54.8% | 56.5% | 53.0% |
Towns in Occitanie with the highest turnout in the second round of the 2022 presidential electionTowns in Occitanie with the highest turnout in the 2024 European elections
Voters as a share of registered voters, with votes added up across the area’s towns; France: excluding French citizens voting abroad. Source: Ministry of the Interior, election results
All towns in the Hérault department (341)
INSEE total population in parentheses. Each town page gives its area, density, national and departmental rankings, and neighboring towns.
- Abeilhan (1,878)
- Adissan (1,394)
- Agde (30,340)
- Agel (247)
- Agonès (328)
- Aigne (304)
- Aigues-Vives (480)
- Alignan-du-Vent (1,843)
- Aniane (3,043)
- Arboras (114)
- Argelliers (1,027)
- Aspiran (1,694)
- Assas (1,447)
- Assignan (177)
- Aumelas (636)
- Aumes (513)
- Autignac (999)
- Avène (299)
- Azillanet (368)
- Babeau-Bouldoux (313)
- Baillargues (7,937)
- Balaruc-le-Vieux (2,772)
- Balaruc-les-Bains (7,238)
- Bassan (2,416)
- Beaufort (216)
- Beaulieu (2,297)
- Bédarieux (6,014)
- Bélarga (670)
- Berlou (211)
- Bessan (5,916)
- Béziers (82,629)
- Boisseron (2,228)
- Boisset (44)
- Boujan-sur-Libron (3,659)
- Bouzigues (1,631)
- Brenas (58)
- Brignac (1,001)
- Brissac (629)
- Buzignargues (387)
- Cabrerolles (351)
- Cabrières (579)
- Cambon-et-Salvergues (54)
- Campagnan (726)
- Campagne (320)
- Camplong (218)
- Candillargues (2,109)
- Canet (3,697)
- Capestang (3,577)
- Carlencas-et-Levas (111)
- Cassagnoles (112)
- Castanet-le-Haut (227)
- Castelnau-de-Guers (1,225)
- Castelnau-le-Lez (26,449)
- Castries (6,984)
- Causse-de-la-Selle (463)
- Causses-et-Veyran (622)
- Caussiniojouls (169)
- Caux (2,755)
- Cazedarnes (693)
- Cazevieille (236)
- Cazilhac (1,636)
- Cazouls-d'Hérault (432)
- Cazouls-lès-Béziers (5,364)
- Cébazan (658)
- Ceilhes-et-Rocozels (247)
- Celles (28)
- Cers (2,552)
- Cessenon-sur-Orb (2,459)
- Cesseras (442)
- Ceyras (1,437)
- Clapiers (6,104)
- Claret (1,790)
- Clermont-l'Hérault (9,607)
- Colombières-sur-Orb (508)
- Colombiers (2,872)
- Combaillaux (2,048)
- Combes (320)
- Corneilhan (1,647)
- Coulobres (376)
- Courniou (623)
- Cournonsec (3,662)
- Cournonterral (7,428)
- Creissan (1,462)
- Cruzy (1,013)
- Entre-Vignes (2,236)
- Espondeilhan (1,294)
- Fabrègues (7,532)
- Faugères (553)
- Félines-Minervois (510)
- Ferrals-les-Montagnes (159)
- Ferrières-les-Verreries (48)
- Ferrières-Poussarou (74)
- Florensac (5,345)
- Fontanès (362)
- Fontès (1,083)
- Fos (136)
- Fouzilhon (250)
- Fozières (200)
- Fraisse-sur-Agout (328)
- Frontignan (24,383)
- Gabian (899)
- Galargues (770)
- Ganges (3,796)
- Garrigues (241)
- Gigean (6,719)
- Gignac (6,830)
- Gorniès (103)
- Grabels (9,188)
- Graissessac (561)
- Guzargues (513)
- Hérépian (1,620)
- Jacou (7,063)
- Joncels (270)
- Jonquières (596)
- Juvignac (14,181)
- La Boissière (1,088)
- La Caunette (328)
- La Grande-Motte (8,524)
- La Livinière (533)
- La Salvetat-sur-Agout (1,117)
- La Tour-sur-Orb (1,373)
- La Vacquerie-et-Saint-Martin-de-Castries (215)
- Lacoste (311)
- Lagamas (115)
- Lamalou-les-Bains (2,412)
- Lansargues (3,274)
- Laroque (1,705)
- Lattes (17,540)
- Laurens (1,838)
- Lauret (646)
- Lauroux (219)
- Lavalette (53)
- Lavérune (3,358)
- Le Bosc (1,453)
- Le Bousquet-d'Orb (1,616)
- Le Caylar (472)
- Le Crès (9,365)
- Le Cros (62)
- Le Pouget (2,174)
- Le Poujol-sur-Orb (977)
- Le Pradal (325)
- Le Puech (269)
- Le Soulié (141)
- Le Triadou (750)
- Les Aires (629)
- Les Matelles (2,120)
- Les Plans (322)
- Les Rives (155)
- Lespignan (3,461)
- Lézignan-la-Cèbe (1,610)
- Liausson (162)
- Lieuran-Cabrières (343)
- Lieuran-lès-Béziers (1,528)
- Lignan-sur-Orb (3,274)
- Lodève (7,500)
- Loupian (2,208)
- Lunas-les-Châteaux (849)
- Lunel (26,923)
- Lunel-Viel (4,535)
- Magalas (3,653)
- Maraussan (4,869)
- Margon (781)
- Marseillan (8,495)
- Marsillargues (7,053)
- Mas-de-Londres (684)
- Mauguio (16,695)
- Maureilhan (2,543)
- Mérifons (62)
- Mèze (12,862)
- Minerve (106)
- Mireval (3,332)
- Mons (695)
- Montady (4,058)
- Montagnac (4,573)
- Montarnaud (4,270)
- Montaud (1,025)
- Montbazin (2,921)
- Montblanc (2,979)
- Montels (251)
- Montesquieu (75)
- Montferrier-sur-Lez (4,299)
- Montouliers (245)
- Montoulieu (221)
- Montpellier (313,712)
- Montpeyroux (1,481)
- Moulès-et-Baucels (900)
- Mourèze (182)
- Mudaison (3,044)
- Murles (363)
- Murviel-lès-Béziers (3,060)
- Murviel-lès-Montpellier (2,108)
- Nébian (1,664)
- Neffiès (1,029)
- Nézignan-l'Évêque (1,751)
- Nissan-lez-Enserune (4,200)
- Nizas (679)
- Notre-Dame-de-Londres (533)
- Octon (533)
- Olargues (496)
- Olmet-et-Villecun (164)
- Olonzac (1,714)
- Oupia (278)
- Pailhès (635)
- Palavas-les-Flots (6,176)
- Pardailhan (195)
- Paulhan (4,111)
- Pégairolles-de-Buèges (56)
- Pégairolles-de-l'Escalette (152)
- Péret (1,154)
- Pérols (9,758)
- Pézenas (8,043)
- Pézènes-les-Mines (245)
- Pierrerue (295)
- Pignan (8,526)
- Pinet (2,075)
- Plaissan (1,739)
- Poilhes (556)
- Pomérols (2,346)
- Popian (389)
- Portiragnes (3,592)
- Poujols (195)
- Poussan (6,888)
- Pouzolles (1,252)
- Pouzols (965)
- Prades-le-Lez (6,290)
- Prades-sur-Vernazobre (381)
- Prémian (486)
- Puéchabon (519)
- Puilacher (672)
- Puimisson (1,245)
- Puissalicon (1,387)
- Puisserguier (3,142)
- Quarante (1,824)
- Restinclières (2,662)
- Rieussec (87)
- Riols (732)
- Romiguières (25)
- Roquebrun (616)
- Roqueredonde (214)
- Roquessels (122)
- Rosis (285)
- Rouet (71)
- Roujan (2,378)
- Saint-André-de-Buèges (47)
- Saint-André-de-Sangonis (6,536)
- Saint-Aunès (4,574)
- Saint-Bauzille-de-la-Sylve (961)
- Saint-Bauzille-de-Montmel (1,268)
- Saint-Bauzille-de-Putois (1,792)
- Saint-Brès (3,670)
- Saint-Chinian (1,833)
- Saint-Clément-de-Rivière (5,401)
- Saint-Drézéry (3,075)
- Saint-Étienne-d'Albagnan (308)
- Saint-Étienne-de-Gourgas (525)
- Saint-Étienne-Estréchoux (262)
- Saint-Félix-de-l'Héras (34)
- Saint-Félix-de-Lodez (1,165)
- Saint-Gély-du-Fesc (10,732)
- Saint-Geniès-de-Fontedit (1,767)
- Saint-Geniès-de-Varensal (203)
- Saint-Geniès-des-Mourgues (2,183)
- Saint-Georges-d'Orques (5,748)
- Saint-Gervais-sur-Mare (872)
- Saint-Guilhem-le-Désert (245)
- Saint-Guiraud (277)
- Saint-Hilaire-de-Beauvoir (464)
- Saint-Jean-de-Buèges (211)
- Saint-Jean-de-Cornies (874)
- Saint-Jean-de-Cuculles (549)
- Saint-Jean-de-Fos (1,778)
- Saint-Jean-de-la-Blaquière (715)
- Saint-Jean-de-Minervois (133)
- Saint-Jean-de-Védas (13,476)
- Saint-Julien (229)
- Saint-Just (3,328)
- Saint-Martin-de-l'Arçon (101)
- Saint-Martin-de-Londres (2,740)
- Saint-Mathieu-de-Tréviers (5,100)
- Saint-Maurice-Navacelles (190)
- Saint-Michel (61)
- Saint-Nazaire-de-Ladarez (333)
- Saint-Nazaire-de-Pézan (633)
- Saint-Pargoire (2,539)
- Saint-Paul-et-Valmalle (1,418)
- Saint-Pierre-de-la-Fage (123)
- Saint-Pons-de-Mauchiens (681)
- Saint-Pons-de-Thomières (1,893)
- Saint-Privat (473)
- Saint-Saturnin-de-Lucian (308)
- Saint-Sériès (991)
- Saint-Thibéry (3,181)
- Saint-Vincent-d'Olargues (359)
- Saint-Vincent-de-Barbeyrargues (797)
- Sainte-Croix-de-Quintillargues (1,009)
- Salasc (365)
- Saturargues (1,044)
- Saussan (2,095)
- Saussines (1,025)
- Sauteyrargues (454)
- Sauvian (5,728)
- Sérignan (8,772)
- Servian (5,626)
- Sète (45,901)
- Siran (767)
- Sorbs (41)
- Soubès (975)
- Soumont (246)
- Sussargues (2,918)
- Taussac-la-Billière (465)
- Teyran (4,872)
- Thézan-lès-Béziers (3,184)
- Tourbes (2,093)
- Tressan (706)
- Usclas-d'Hérault (445)
- Usclas-du-Bosc (258)
- Vacquières (784)
- Vailhan (143)
- Vailhauquès (2,757)
- Valergues (2,263)
- Valflaunès (806)
- Valmascle (52)
- Valras-Plage (4,489)
- Valros (1,714)
- Vélieux (97)
- Vendargues (7,345)
- Vendémian (1,173)
- Vendres (2,685)
- Verreries-de-Moussans (85)
- Vias (6,024)
- Vic-la-Gardiole (3,456)
- Vieussan (271)
- Villemagne-l'Argentière (425)
- Villeneuve-lès-Béziers (4,565)
- Villeneuve-lès-Maguelone (11,010)
- Villeneuvette (67)
- Villespassans (190)
- Villetelle (1,802)
- Villeveyrac (4,045)
- Viols-en-Laval (236)
- Viols-le-Fort (1,249)
Sources: INSEE, official population figures in force on January 1, 2026 (total population); land area: IGN / Observatoire des territoires. Rankings computed across the 34,875 communes in the database.